Phylogeny
Phylogeny is the history of evolution of a given species (and their genes) and the relationship between other species (and their similar genes). The idea behind this is that different species (with different genes) have essentially all descended from the common ancestors. The basic conclusions of phylogenetic data is that although different species have a significant amount of difference from one another (evolution), they also bear quite similar aspects due to evolving from the same species, and the passing down of similar genetics. [1] Many different techniques are used for calculating and creating the trees. These specific phylogenetic trees will allow us to be able to see visually the level of interrelatedness among the gene of interest (Factor VIII) in different species. An entire organism can be collectively compared to others, or just a tiny part, which will be used on this page, where only a gene is used.
CALCULATING PHYLOGENETIC TREE DISTANCE
Trees are constructed by mathematically determining the degree to which the sequence pairs are homologous and then assigning an appropriate distance which is represented graphically in the trees. Two of the modeling tools that I used in my phylogeny trees were Percent Identity (PID) and BLOSUM62. [4]
- Percent Identity: Determines the percentage of bases that are analogous in the alignment. [4]
- BLOSUM62: Uses a slightly more complex algorithm, relative to PID. As shown below in Figure 1, the Pab is the probability that two sequences correlate in the alignment. The fafb symbolizes the "null hypothesis"- that two sequences have no homology. [2]
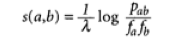
Figure 1. BLOSUM62 Algorithm [1]
|
NEIGHBOR JOINING TREE
This is a fairly complex algorithm for finding the tree with the shortest branch length. However, this method has been invalidated through the study of other scientists. It has been known to use the "Minimal Evolutionary Principle", meaning that it does not account for high evolutionary variance. [3] |
AVERAGE DISTANCE TREE
This method simply creates the tree by using data from the PID tool, and places them at an average distance from each other. [4] |
Phylogenetic Trees of Homology in FVIII gene
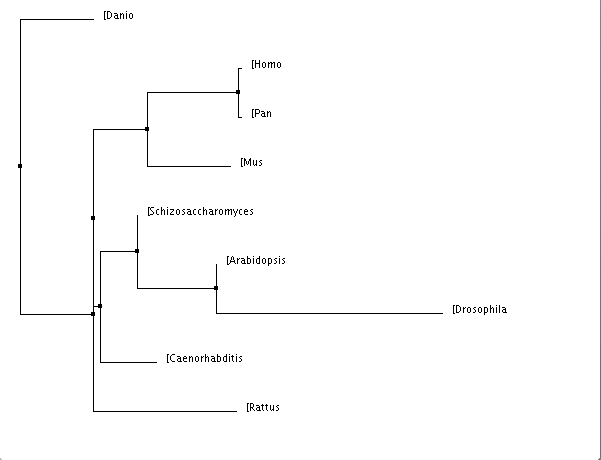
Figure 2. Neighbour joining tree using PID
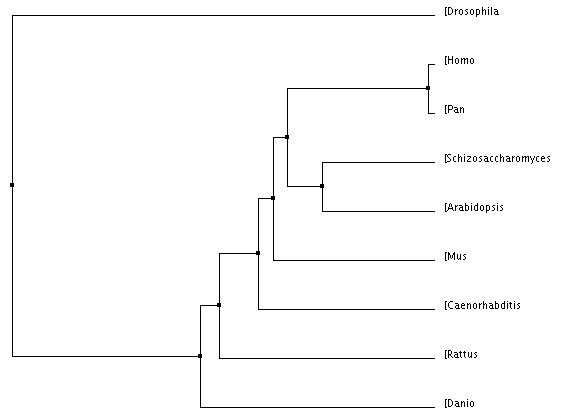
Figure 4. Average distance tree using PID
|
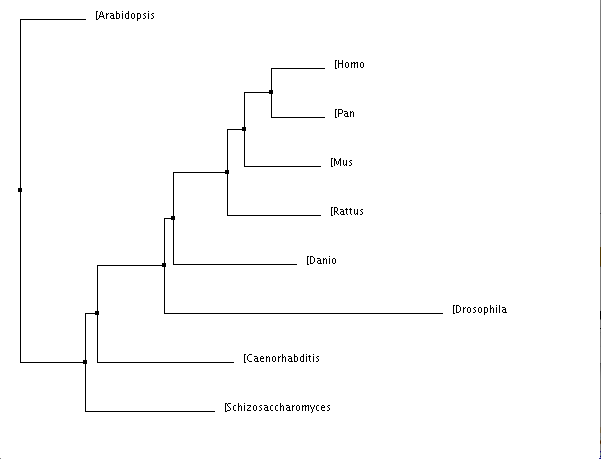
Figure 3. Neighbour joining tree using BLOSUM62
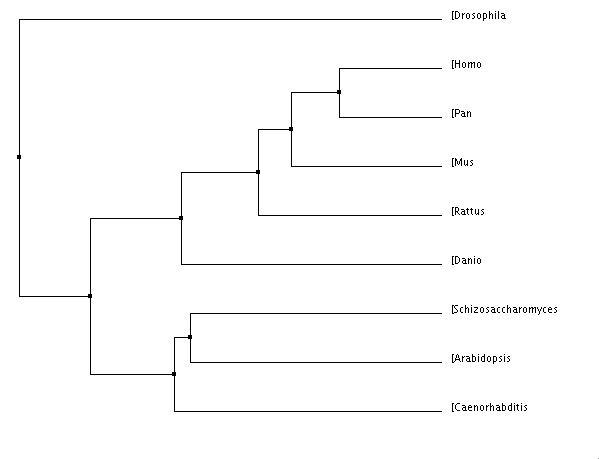
Figure 5. Average distance tree using BLOSUM62
|
Analysis
Figure 3 is the easiest image to see the evolutionary resemblance between Factor VIII in different species. Factor VIII is a coagulation factor, which we typically associate with the blood clotting cascade. It is not surprising that the most closely related species are pan troglodytes (chimpanzee), mouse, and rat since they are all mammals and definitely have quite similar blood systems. To see Danio rerio (zebrafish) so closely related to mammals is slightly surprising because they do have blood, but they obviously have different blood systems than mammals. It does not surprise me that Drosophila melanogastor (fruit fly) is one of the most distanced from the rest of the species, after all, flies do not have blood. However, that the fruit fly even has a gene that can be recognizably related to the Factor VIII gene is very surprising. This could be a very interesting and easy model organism to use when going about my research into Hemophilia A.
References
[1] http://www.merriam-webster.com/dictionary/phylogeny
1. Henikoff, S., & Henikoff, J. G. (1992). Amino acid substitution matrices for protein blocks. Proc Natl Acad Sci USA, 89(22), 10915-10919. http://www.ncbi.nlm.nih.gov/pubmed/1438297
2. Eddy, S. R. (2004). Where did the blosum64 alignment score matrix come from?. Nature Biotechnology,22(8), 1035-1036. Retrieved from http://cromatina.icb.ufmg.br/FMG/blast/Eddy.pdf
3. Gasceul, O., & Steel, M. (2006). Neighbor-joining revealed. Molecular Biology and Evolution,23(11), 1997-2000. http://mbe.oxfordjournals.org/content/23/11/1997.abstract
4. Calculation of trees from alignment. (n.d.). Retrieved from http://www.jalview.org/help/html/calculations/tree.html
5. ClustalW and ClustalX version 2 (2007)
Larkin MA, Blackshields G, Brown NP, Chenna R, McGettigan PA, McWilliam H, Valentin F, Wallace IM, Wilm A, Lopez R, Thompson JD, Gibson TJ and Higgins DG
Bioinformatics 2007 23(21): 2947-2948.
doi:10.1093/bioinformatics/btm404
6. Homologene, National Center for Biotechnology Information. (n.d.). Retrieved from website: http://www.ncbi.nlm.nih.gov/homologene
7. BLAST: Basic Local Alignment Search Tool, National Library of Medicine. (n.d.). Retrieved from website: http://blast.ncbi.nlm.nih.gov/Blast.cgi
